Monitoring
Monitoring with Graunt
Moreover, finding some Truths and not-commonly-believed opinions to arise from my meditations upon these neglected Papers, I proceeded further to consider what benefit the knowledge of the same would bring to the world, … with some real fruit from those ayrie blossoms.
– John Graunt, „Natural and Political Observations Mentioned in a following Index, and made upon the Bills of Mortality.“ (1662)
Overview
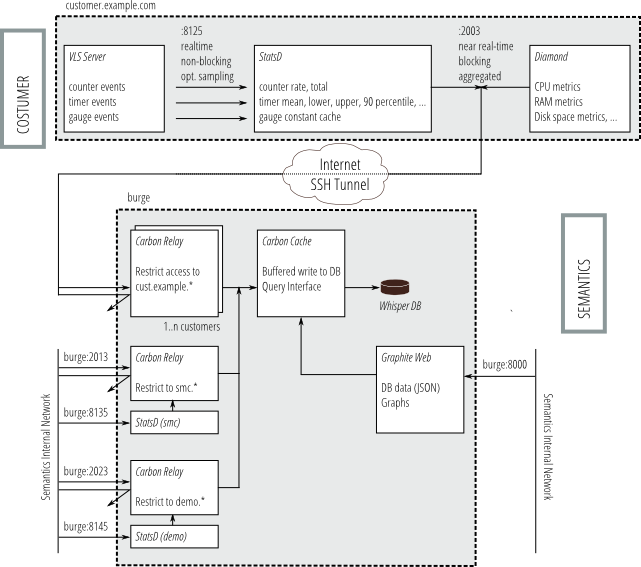
The graunt package includes services to collect, aggregate, store, and
display statistics on the performance of software and hardware (client)
instances in the network.
At the core, the whisper round-robin databases provide a fixed-size
storage pool for aggregated statistical data. Recent data is stored with
a high time resolution. Older data is aggregated and stored more
efficiently with less resolution. The amount of data is configurable.
The carbon-cache service accepts individual measurements, organized in
a hierarchical namespace of whisper databases. Databases are created on
demand when new names are encountered.
Access to databases is restricted through instances of the
carbon-relay service. There is one such service for each protected
namespace domain. Typically, there are several namespaces for the
company network and one namespace for each customer.
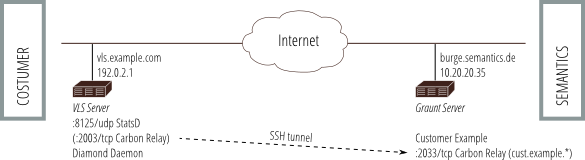
The carbon-relay ports are made available on the internal network, or,
in the case of customer access, over a dedicated SSH tunnel to an
account on the customer’s machine that is locked down to only allow port
fowarding of a single network port.
The aggregated data is exposed through the graphite web service, which
includes a rich API to create graphs from the data, and also offers a
configurable dashboard.
The default client is diamond, which comes with a variety of
collectors for different system parameters and services.
For regular or ad-hoc instrumentalisation of deployed applications,
bucky provides a statsd interface to carbon, which runs locally to
the application instance and forwards pre-aggregated data to the central
server.
The tools (except for SSH and library dependencies) are implemented in Python.
The following diagram gives an overview of the whole system.
Installation
graunt comes as a GIT repository. After cloning, the submodules need
to be initialized:
$ git clone graunt.git graunt
$ cd graunt
[graunt]$ git submodules init
[graunt]$ git submodules update
Building graunt requires Python 2.7, Bash, OpenSSH and libevent
development files to be available on the system. There are makefile
targets to install the prerequisites:
[graunt]$ make prepare-fedora
Finally, the virtualenv for graunt can be set up with:
[graunt]$ make
The downloaded Python dependencies are cached in the directory cache,
which can be reused.
Variable data, including the RR databases, are stored in the directory
var, which can be carried over from one instance of graunt to another.
The target directory contains the virtualenv where all packages are
installed. It can be removed and rebuilt at will, as it does not contain
any variable data.
As all configuration files use relative paths, graunt is fully
relocatable. As a consequence, care must be taken when starting
graunt, see below.
Running
All services in graunt are started through Mozilla’s circusd
service. The configuration file uses relative paths, so circusd has to
be run from the graunt root directory. The wrapper script takes care of
that:
[any]$ /path/to/graunt/circusd
The script auto-detects the graunt directory, so it can be run from
anywhere.
As graunt runs in a virtualenv, all tools can be run directly from
the target/bin directory, which can also be added to the user’s PATH
variable:
[graunt]$ target/bin/circusctl stats
[graunt]$ target/bin/circusctl stop diamond
[graunt]$ target/bin/circusctl start diamond
Database
graunt uses the whisper database format. The
database files are located at var/carbon/whisper and organized in a
hierarchical namespace. carbon-relay servers are used to restrict
access to specific namespaces only.
Namespace |
Description |
|---|---|
|
Statistics about the carbon cache and relay servers |
|
Namespaces for customer installations |
|
Namespaces for Semantics network |
|
Namespaces for Semantics demo portals |
Customer namespaces are subdivided:
Namespace |
Description |
|---|---|
|
Namespaces for customer operating systems |
|
Namespaces for customer portals |
The available databases in each namespace are dependent on the services that are monitored.
Storage and Aggregation
Storage rules are set in etc/carbon/storage-schemas.conf, while
aggregation rules are in etc/carbon/storage-aggregation.conf.
The current default retention is:
Resolution |
Duration |
|---|---|
10s |
1d |
1m |
10d |
1h |
400d |
1d |
10y |
The resulting database files are 436 kB small.
The default aggregation method is average.
Network Configuration
The following ports are used by graunt internally:
Port |
Proto |
Host |
Description |
|---|---|---|---|
2003 |
tcp |
127.0.0.1 |
|
2004 |
tcp |
127.0.0.1 |
|
2033 |
tcp |
127.0.0.1 |
|
2043 |
tcp |
127.0.0.1 |
|
… |
etc |
||
5555 |
tcp |
127.0.0.1 |
|
5556 |
tcp |
127.0.0.1 |
|
5557 |
tcp |
127.0.0.1 |
|
7002 |
tcp |
127.0.0.1 |
|
The line interface is especially useful for manual testing.
The pickle interface is not very secure, but it is required by the local carbon-relay daemons.
Customer relays are accessed through dedicated SSH tunnels.
The following ports are external entry points:
Port |
Proto |
Host |
Description |
|---|---|---|---|
2013 |
tcp |
0.0.0.0 |
|
2023 |
tcp |
0.0.0.0 |
|
8000 |
tcp |
0.0.0.0 |
|
8135 |
udp |
0.0.0.0 |
|
8145 |
udp |
0.0.0.0 |
|
At each customer server, the following port is forwarded over a SSH tunnel to one of the customer ports above (2050, 2051, 2052, etc).
Port |
Proto |
Host |
Description |
|---|---|---|---|
2003 |
tcp |
127.0.0.1 |
|
8125 |
udp |
0.0.0.0 |
|
Configuration
For each customer (here: CUSTOMER), the following configuration needs
to be done on the central statsd server (burge.semantics.de).
Activate the graunt user and go to environment:
[burge]$ sudo -u graunt bash
[graunt]$ cd /home/graunt/graunt
Per-Customer Configuration
The per-customer carbon-relay provides isolated access to the whisper
databases, such that the customer servers can only log data to the
cust.CUSTOMER namespace.
For this, the following steps need to be taken:
Pick a local port number for the
carbon-relayline interface (no pickle interface is allowed due to security concerns). Here, we choose 2023.Create a new file
graunt/etc/customers.d/CUSTOMER.iniwith:[customer:CUSTOMER] relay_port = 2023
See below for more information on the configuration file.
Rebuild the configuration:
[graunt]$ ./rebuild-config
An SSH key pair is generated if it doesn’t exist already. So far, we
have only configured a carbon-relay server that is ready to accept
data. We have not configured any SSH tunnels through which clients can
actually send such data. Usually, you will want to add hosts to connect
to before rebuilding the configuration again and restarting circus.
Per-Host Configuration
A user account (here: vlstat) needs to be set up on each customer
server (here: CUSTOMER.EXAMPLE.COM) and configured to accept an SSH
connection for port forwarding.
The SSH public key needs to be copied to the remote server:
[graunt]$ scp -P 22 etc/ssh/id_customer.pub CUSTOMER.EXAMPLE.COM:
Create the new user and disable login and password authentication:
[customerhost]$ sudo useradd --shell /bin/true vlstat
[customerhost]$ sudo usermod --lock vlstat
[customerhost]$ sudo mkdir /home/vlstat
[customerhost]$ sudo chown vlstat.vlstat /home/vlstat
[customerhost]$ sudo mkdir /home/vlstat/.ssh
[customerhost]$ sudo chown vlstat.vlstat /home/vlstat/.ssh
[customerhost]$ sudo chmod 0700 /home/vlstat/.ssh
For Suse-Linux:
[customerhost]$ useradd --shell /bin/true -g nogroup vlstat
[customerhost]$ sudo usermod -L vlstat
[customerhost]$ sudo mkdir /home/vlstat
[customerhost]$ sudo chown vlstat:nogroup /home/vlstat
[customerhost]$ sudo mkdir /home/vlstat/.ssh
[customerhost]$ sudo chown vlstat /home/vlstat/.ssh
[customerhost]$ sudo chmod 0700 /home/vlstat/.ssh
The
/home/vlstat/.ssh/authorized_keysshould have a single entry with the public key and the following configuration:[customerhost]$ echo 'no-pty,command="/bin/false",no-agent-forwarding,no-user-rc,no-X11-forwarding,permitopen="127.0.0.1:2003"' `cat id_CUSTOMER.pub` | sudo tee -a /home/vlstat/.ssh/authorized_keys [customerhost]$ sudo chmod 0600 /home/vlstat/.ssh/authorized_keys [customerhost]$ sudo chown vlstat.vlstat /home/vlstat/.ssh/authorized_keys
For Suse-Linux:
[customerhost]$ sudo chown vlstat:nogroup /home/vlstat/.ssh/authorized_keysThis configuration achieves that a compromised key can at most be used to intercept the statistics data and interfere with its collection.
In the file
graunt/etc/customer.d/CUSTOMER.ini, add a new section:[host:CUSTOMER.EXAMPLE.COM] customer=CUSTOMER ssh_user=vlstat ssh_port=22 # can be omitted, 22 is default
Rebuild the configuration:
[graunt]$ ./rebuild-configThis will also retrieve the server certificate and add it to
graunt/etc/ssh/known_hosts, where it is cached (to detect man in the middle attacks). You might be able to check the validity of the retrieved certificate with a second communication channel. It is also not a bad idea to add the certificate to the above configuration section under thessh_certificatekey.Reload the circusd configuration for the changes to take effect:
[graunt]$ ./circusctl reloadconfigNormally, this should restart all changed watchers and start newly added watchers. If this does not work correctly,
circusdcan be restarted with:[graunt]$ ./circusctl quit [graunt]$ ./circusd
On the customer host, install and configure a bucky server for statsd logging from applications (do not use a branch under /opt/vlsXXX).
Install diamond and bucky:
[customerhost]$ cd /opt/vls
[customerhost]$ bin/vlshell
[VLS]$ paver install_stats
First copy the bucky configuation template then modify the file::
[VLS]$ cp etc/bucky.conf.in etc/bucky.conf
[VLS]$ vi etc/bucky.conf
Edit the customer name in
name_prefix_parts:name_prefix_parts = ["cust", "CUSTOMER"]
This will result in all statsd metrics being prefixed by
cust.CUSTOMER. Note that any period (.) in a name part is replaced with an underscore (_).Install (and edit) the
supervisordconfiguration for bucky as admin.:[customerhost]$ cp etc/supervisord.conf.d/bucky.ini /etc/supervisord.conf.dMake sure the paths are OK for your installation.
Activate and start bucky:
[VLS]$ supervisorctl add bucky
[VLS]$ supervisorctl start bucky
Dirk - I had more luck with:
[VLS]$ supervisorctl reread
[VLS]$ supervisorctl update
[VLS]$ supervisorctl start bucky # probably already autostarted
On the customer host, install and configure a diamond server for system statistics.
First copy the diamond configuation template then modify the file::
[VLS]$ cp etc/diamond/diamond.conf.in etc/diamond/diamond.conf
[VLS]$ vi etc/diamond/diamond.conf
Edit the customer name in
path_prefixin thecollectors.defaultsection:path_prefix = cust.CUSTOMER.host
This will result in all diamond metrics being prefixed by
cust.CUSTOMER.host.SERVERNAME.Currently, you have also set the following (why?):
collectors_path = /opt/vls/lib/python2.7/site-packages/diamond-3.3.506.patch4-py2.7.egg/share/diamond/collectors
Also, verify the settings for
server.pid_file. Logging configuration is ignored and does not need to be adjusted, as logging happens through supervisord.Install (and edit) the
supervisordconfiguration for diamond as admin:[customerhost]$ cp etc/supervisord.conf.d/diamond.ini /etc/supervisord.conf.dMake sure the paths are OK for your installation.
Activate and start diamond:
[VLS]$ supervisorctl add diamond
[VLS]$ supervisorctl start diamond
Diamond
diamond by BrightcoveOS is a daemon that collects system metrics and
publishes them to carbon. By default, the following collectors are
enabled:
cpu
disk space
disk usage
load avg
memory
sockstat
vmstat
More collectors are available, too.
Security
carbon only aggregates data when moving it from one time resolution to
another. It does not aggregate incoming data with existing data in the
database. This means that if two data points arrive that fall into the
same time resolution slot, the second overwrites the first. If data is
generated more frequently than the highest time resolution, bucky
should be used to aggregate the data locally before sending it to
carbon less frequently.
Also, there is no freshness check on incoming statistics in carbon: A
single write to a specific time in the past overwrites the aggregated
data for that time slot.
carbon-cache must bind to localhost only, as otherwise anybody with
access to the port can override any data in any namespace. As there is
no authentication between the carbon-relay instances and
carbon-cache, the machine running graunt should not be used for any
other purpose.
carbon-relay that are forwarded over SSH must bind to localhost only
for the same reason. The remote account must be dedicated to carbon
and allow forwarding of that one port only, as the key is stored
unprotected in the graunt SSH configuration. Each relay restricts
incoming data to whitelisted namespaces only.
carbon-relay ports for company data should only be accessible from the
internal network.
StatsD
The statsd interface has the following properties compared to the
carbon line interface:
It uses UDP as a transport, which means that a failing service does not impact the function of the application that sends the metrics.
The data can be high-frequency and is aggregated before sending it to
carbon.Several statistics are derived from a data series, and the resulting statistics are also sent to
carbon.
There are light-weight client libraries available to add instrumentation to an existing application easily.
Upstream documentation is available.
StatsD metric types
The following metric types are supported (as described in the upstream documentation:
Type |
Description |
|---|---|
counter |
Event count per second. |
timer |
Time interval measurements with various statistics. |
gauge |
Constant data that is already aggregated. |
Counter Metrics
Counters are events per second. They are counted and normalized in the
statsd server, so that the application only needs to report
increments. To save bandwidth to the statsd server, client libraries
support setting a sample rate (only a sample of the counter increments
are reported to statsd in that case, which upscales the samples).
Name |
Description |
|---|---|
|
The total number of events. |
|
The average number of events per second. |
Timer Metrics
Timers are durations in milliseconds. From the raw data, various statistics are reported.
Name |
Description |
|---|---|
|
Average (currently of 90 percentile) |
|
Maximum |
|
90 percentile |
|
Minimum |
|
Number of data points |
Gauge Metrics
Gauges are constant values that do not change until they are updated.
Because they are resubmitted by statsd in each flush interval, an
unchanged gauge yields a flat line in the graph.
Gauges are stored directly under the provided name.
Example Letter
Sehr geehrter Herr/Frau …,
um Ihnen bei der Sicherstellung der Verfügbarkeit und Behebung von möglichen Problemen in VLS Instanzen schneller und einfacher helfen zu können, sind wir dabei, unser Leistungskennzahlen-System von vorher „collectd“ auf jetzt „carbon“ umzustellen. Daraus ergibt sich eine Änderung in der Netzwerkkonfiguration:
Bisher wurden Leistungskennzahlen über UDP auf Port 25826 unverschlüsselt übertragen.
In dem neuen System werden die Leistungskennzahlen verschlüsselt über einen SSH Tunnel übertragen, der vom Semantics-Netzwerk ausgehend initiiert wird. Dazu wird auf ihrem System ein neuer Benutzer „vlstat“ angelegt. Dieser wird über technische Schutzmassnahmen so eingeschränkt, dass er ausschliesslich zur Errichtung eines Port-Forwarding-Tunnels (lokaler TCP Port 2003) verwendet werden kann (kein Shell-Zugang). Die SSH Verbindung wird dauerhaft aufrecht erhalten und bei Verbindungsabbruch automatisch neu aufgebaut, und ausschliesslich zur Übermittlung der Leistungskennzahlen verwendet.
Der bereits bestehende SSH Zugang kann von uns dazu verwendet werden. Es sind also ggf. keine Anpassungen Ihrerseits nötig.
Die Umstellung befindet sich noch im Testbetrieb. Nach Abschluss der Umstellung fällt der unverschlüsselte UDP Port weg und kann von Ihnen in der Firewall gesperrt werden. Wir werden sie darüber dann noch gesondert in Kenntnis setzen.
Ihre Vorteile sind, dass die Verbindung in Zukunft vollständig verschlüsselt ist, und dass wir mit dem neuen System Leistungsprobleme in Zukunft schneller erkennen und beheben können. Wir hoffen deshalb, dass die Umstellung auch in Ihrem Sinne ist.
Mit verehrten Grüssen,